Anyone selling on Amazon knows the challenges of that platform.
On the one hand Amazon is the best thing going; the biggest, the baddest — everyone shops there and it’s probably the only company in the world that’s grown year over year, every year, for the past decade. Nothing beats it.
On the other side of that, of course, is the proprietary nature of the beast, the “how thou must”s and the “we shall not”s and every other quirky way Amazon decides to run their business. And it is their business, as they waste no time letting you know, and so running your business within that framework involves a lot of adjusting and adapting. The tradeoff is worth it, of course — well worth it — but all the wonderful gains do little to ease the frustration. So yes, keeping track of your Amazon business brings with it challenges. Not least of which is:
Just how the heck do you get a clear view of what’s going on?
Why We’re Here
ManageByStats was created to ease those frustrations, and to answer that question. Since its inception ManageByStats has provided tools for gathering your Amazon sales, inventory and customer data in one place, presenting it clearly, easily and painlessly for your consumption. Doing that has allowed ManageByStats to help thousands of users more effectively manage and grow their Amazon business.
Along the way we’ve made improvements. All good software does. And not just “improvements” to keep up with the (seemingly) whimsical changes enacted by Amazon, but coming up with truly better solutions. Some time back we released such a solution, bringing real-time data to the Dashboard in the form of what we call Dashlets. Now we’re taking them to a whole new level.
The Amazing, Wonderful, Cute-Sounding Dashlets
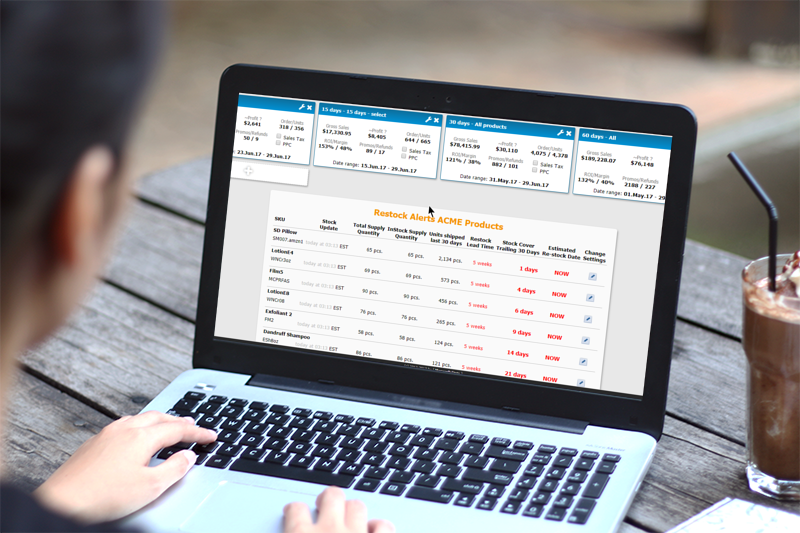
A little more on these. For starters, they are kind of cute. When first launched they were small, configurable, colorful boxes you could customize and place on your Dashboard for quick-reference Sales info. As such they were not only cute, but powerful; handy for when you needed a quick, instant look at how things were going. With our latest release we’ve expanded the configuration options for the Dashlets (while keeping them cute), as well as adding two more Dashlet types.
You can now create Dashlets for:
- Sales
- Inventory (Restock Alerts)
- Payouts
In addition you can create Headers, which allow you to logically separate various data, as well as Dashboard tabs, which let you create entire custom Dashboards to display your data with a multitude of sort options.
The options for customizing your Dashboard are now nearly limitless.
Each Sales Dashlet shows you:
- Gross Sales
- Profit (factoring in Sales and PPC if desired)
- Orders and Units
- ROI and Margin
- Promos and Refunds
This is real-time data, and can even be slightly ahead of the data displayed on your Amazon Sales Summary. You can choose to display each Sales Dashlet by a wide range of dates, and choose to see comparison info for the same prior period, as well as the same period last year.
Check Them Out
Log into your ManageByStats and check out the new Dashlet training videos. At the time of this writing we have a “Dashboard Live – Beta” option, where you can start using these new Dashboard options right away. Click the Help on your Dashboard to watch the training videos and get started.
Thanks for reading. Here’s to the increasingly easy management of your Amazon business, leading to greater insight, grander ideas, and rapid expansion.
All the best,
The ManageByStats Team
