Yes, we’re calling them “dashlets”. What are we calling dashlets? The new little configurable info boxes on the ManageByStats Dashboard.
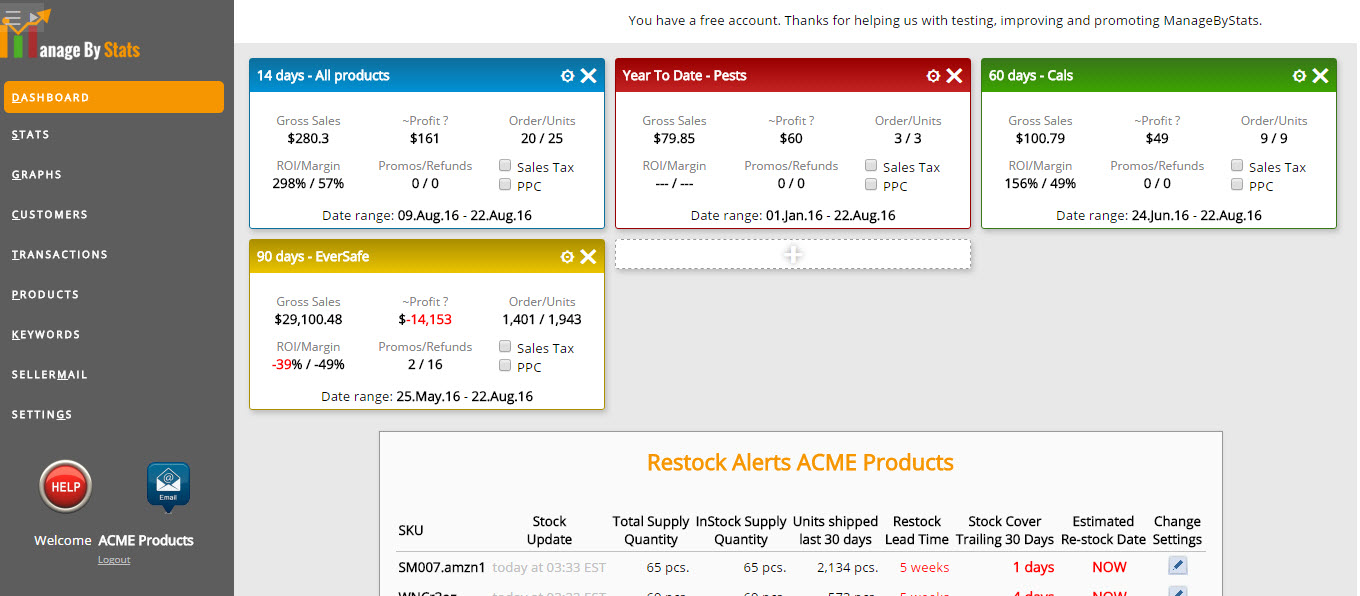
Hello. By now you’ve probably seen them. In the BD (Before Dashlets) era the Dashboard featured just a few basic bits of info, such as your last Statement payouts, any Restock Alerts and billing info. That info is still there, but with the new dashlets your Dashboard has the potential to become so much more. Now you can create and add the small windows, specifying products or groups of products, date ranges, and whether or not you want to see info for the previous period to gauge relative performance. Each dashlet shows:
- Gross Sales
- Approximate Profit
- Orders and Units
- ROI and Margin
- Promos and Refunds
You can also choose to include Sales Tax or PPC info. Together this range of options lets you create:
- real time updates
- snapshot, at-a-glance info on performance and sales
The Dashboard is the first page you see when you log in. With the new feature you might, for example, create a dashlet to show the gross sales for the last 30 days (updating in real time). Or, say you want to create a dashlet for each product, showing figures for the last 30, 15 and 7 days. You can do that too, and anything in between. The whole system is very customizable.
We invite you to take a look. Dashlets are on your Dashboard now. Create new dashlets by clicking the “+” on your Dashboard and configuring the settings you want. They’re easy to add, easy to remove, and they can be dragged and positioned as desired to create the Dashboard of your dreams.
Thanks for reading. And as always:
To your success.
